Metrics and Metric Groups
Metrics are used to capture both key performance indicators and relevant metadata for tasks on a schedule. Examples include operational outputs such as tons of material moved or vehicles charged, as well as contextual information like start and end locations for haul trips. Together, metrics provide the quantitative and qualitative data needed to track performance, understand outcomes, and analyse operations over time.
Defining which metrics to capture
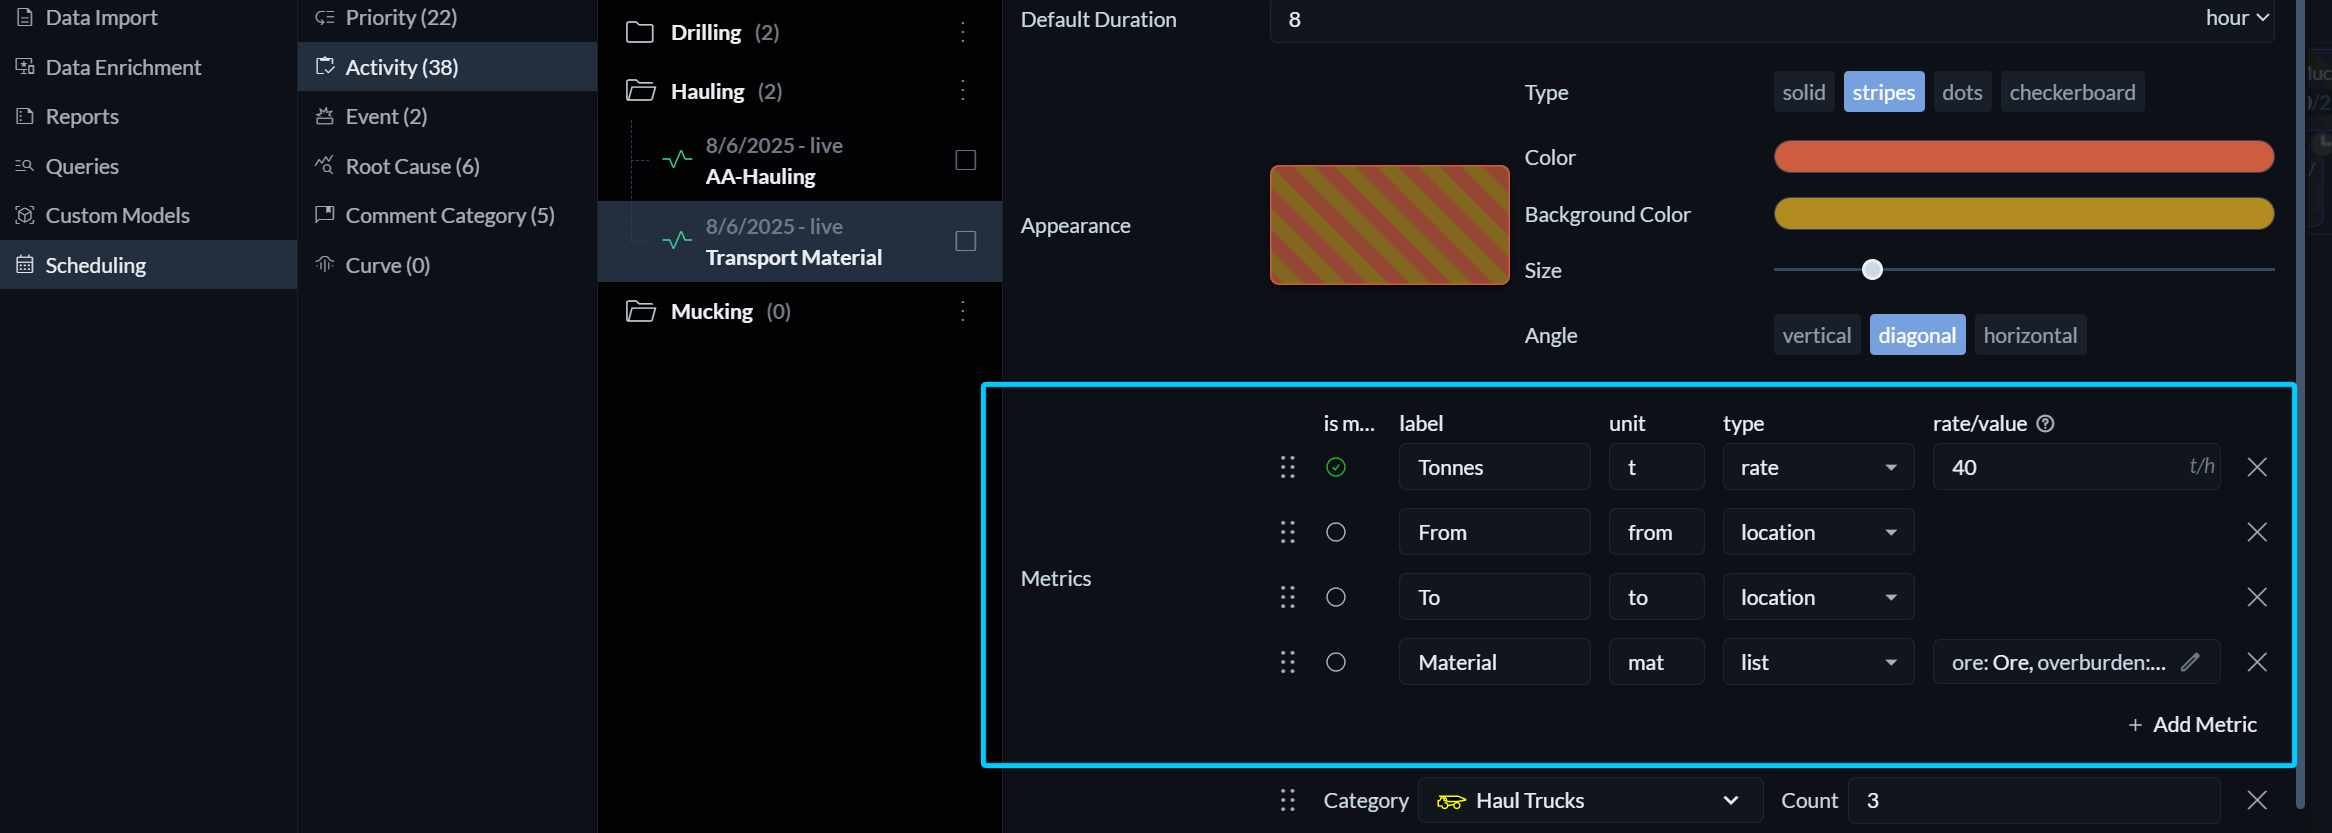
Metrics are defined as part of an activity. Each metric has a label, a unit, and a type that determines how values are entered, calculated, and interpreted. Depending on the selected type, additional configuration options may be available.
Main metric
Each activity must define exactly one main metric. The main metric represents the primary measure of success for that activity and must be numeric, meaning it must be of type Value or Rate.
The ratio between the main metric’s expected and actual values drives several core behaviours in Hivekit. It determines the visual progress and completion state of tasks (as reflected in their background colour) and is used for goal and performance calculations in the table view.
Label and unit
Labels and units provide clarity and consistency when metrics are displayed and recorded. Clear naming and appropriate units make it easier for users to understand what is being measured and to enter data correctly.
Metric types
Each metric has a specific type that defines how data is captured and interpreted.
-
Rate: A rate represents a quantity per hour, such as 40 tons per hour or three pickups per hour. The expected value is calculated automatically based on the task’s duration and is updated if the duration changes. This makes rates well suited for activities where output scales with time, such as hauling or drilling. Rate metrics support metric formulas.
-
Value: A value represents a fixed quantity that does not depend on task duration, such as installing six bolts or completing a single inspection. The expected value remains constant even if the task duration changes. Value metrics also support metric formulas.
-
Text: Text metrics allow users to enter free-form information. They are useful for recording unstructured observations, notes, or comments that do not fit into a numeric format.
-
Location: Location metrics require the user to select a value from the list of available locations. This is commonly used to capture information such as source and destination points.
-
Object: Object metrics require the user to select from a list of available objects, such as people, vehicles, or equipment.
-
List: List metrics consist of predefined key–value options. They are useful for standardised classifications, such as material types or condition codes.
Metric formulas
Metrics of type Rate and Value support formulas. Formulas allow expected values to be calculated dynamically using logic that can include environmental variables, such as the size of a heading, equipment characteristics, curves, or other contextual factors. More complex logic is also supported, including conditional expressions and lookups.
For a detailed explanation of formulas and available functions, see the dedicated section on metric formulas.
Entering metrics
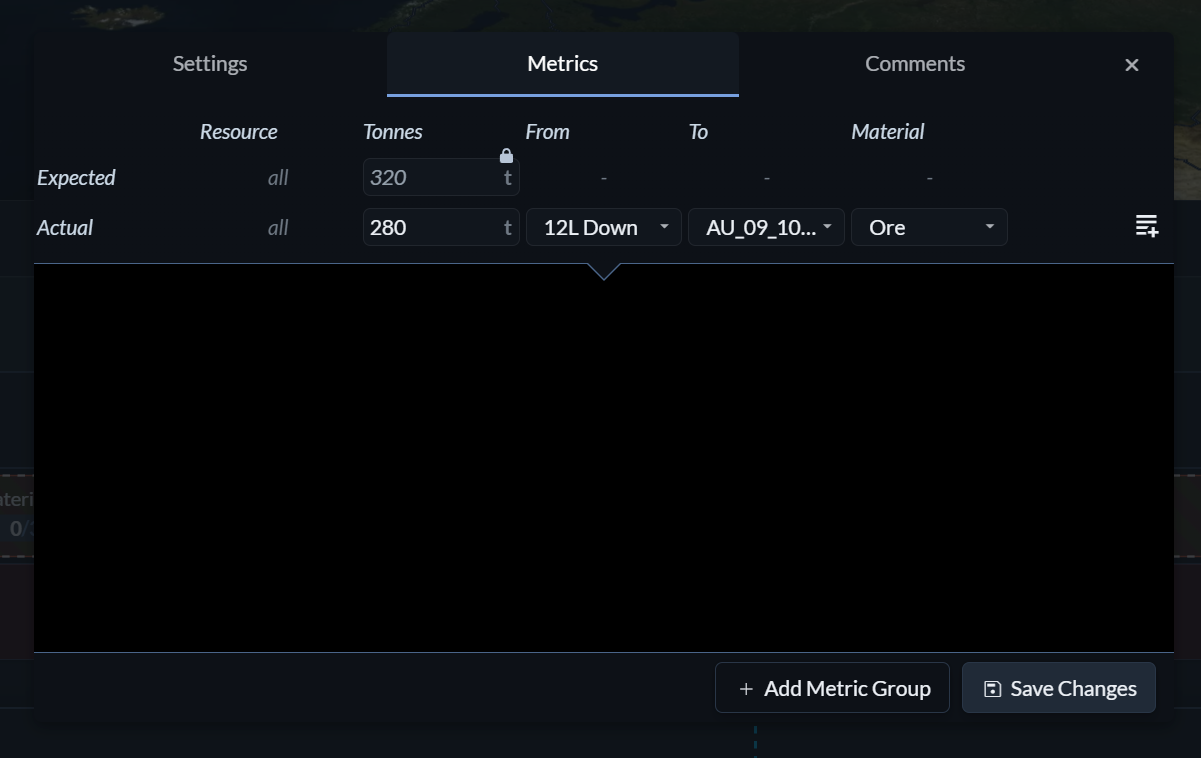
Metrics are recorded against individual tasks in the schedule. In the timeline view, select a task and click Set Metrics. In the table view, metrics can be entered directly in the columns to the right of the task.
The top rows in the metrics window display the expected and actual values for the selected task. Expected values can be overridden by typing directly into the expected field. Doing so unlocks the value, meaning it will no longer be automatically recalculated when the task duration changes or when environmental factors, such as location data, are updated. To revert to automatic calculation, click the lock icon again.
The bottom row provides a type-specific input field for recording the actual metric value. The icon on the right allows you to specify a root cause, which can be used to add additional context or explanation.
Metric groups
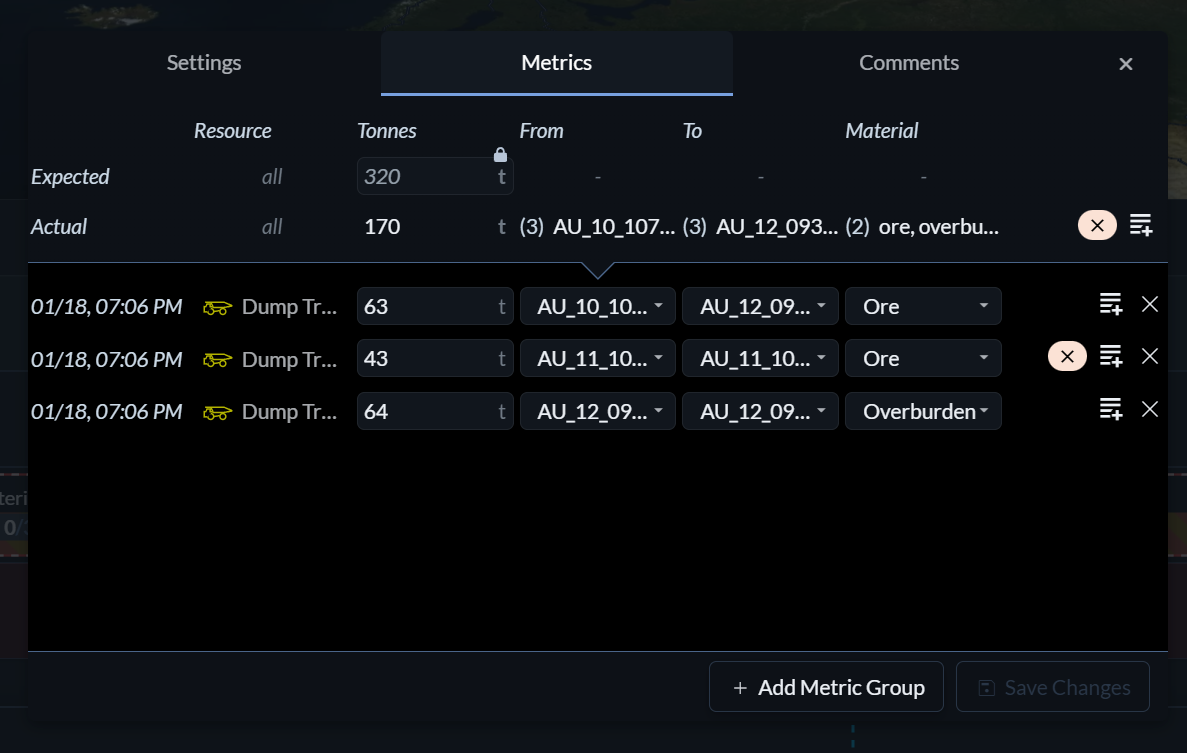 In many cases, the total performance of a task is the result of multiple individual contributions rather than a single action. For example, moving 2,000 tons of material from underground to surface typically involves many trucks making multiple trips between different locations.
Metric groups are designed to capture these individual contributions. Each metric group entry records a distinct step for a specific resource, such as a particular truck hauling 60 tons of ore from location A to location B. Hivekit automatically aggregates these entries and uses the result as the actual value for the task.
Once metric groups are used for a task, the task’s actual values are no longer directly editable. Any previously entered actuals will be overwritten by the aggregated results from the metric group entries.