Curves
Hivekit automatically calculates expected values for metrics based on activity definitions and scheduling parameters. In practice, however, operations rarely aim to simply meet a static target. Performance is expected to improve over time as processes, skills, and conditions evolve. Curves are designed to model this improvement (or, where appropriate, decline) in a controlled and transparent way.
A curve defines how expectations change over time. This change can be linear, step-based, or follow a more complex progression.
Defining curves
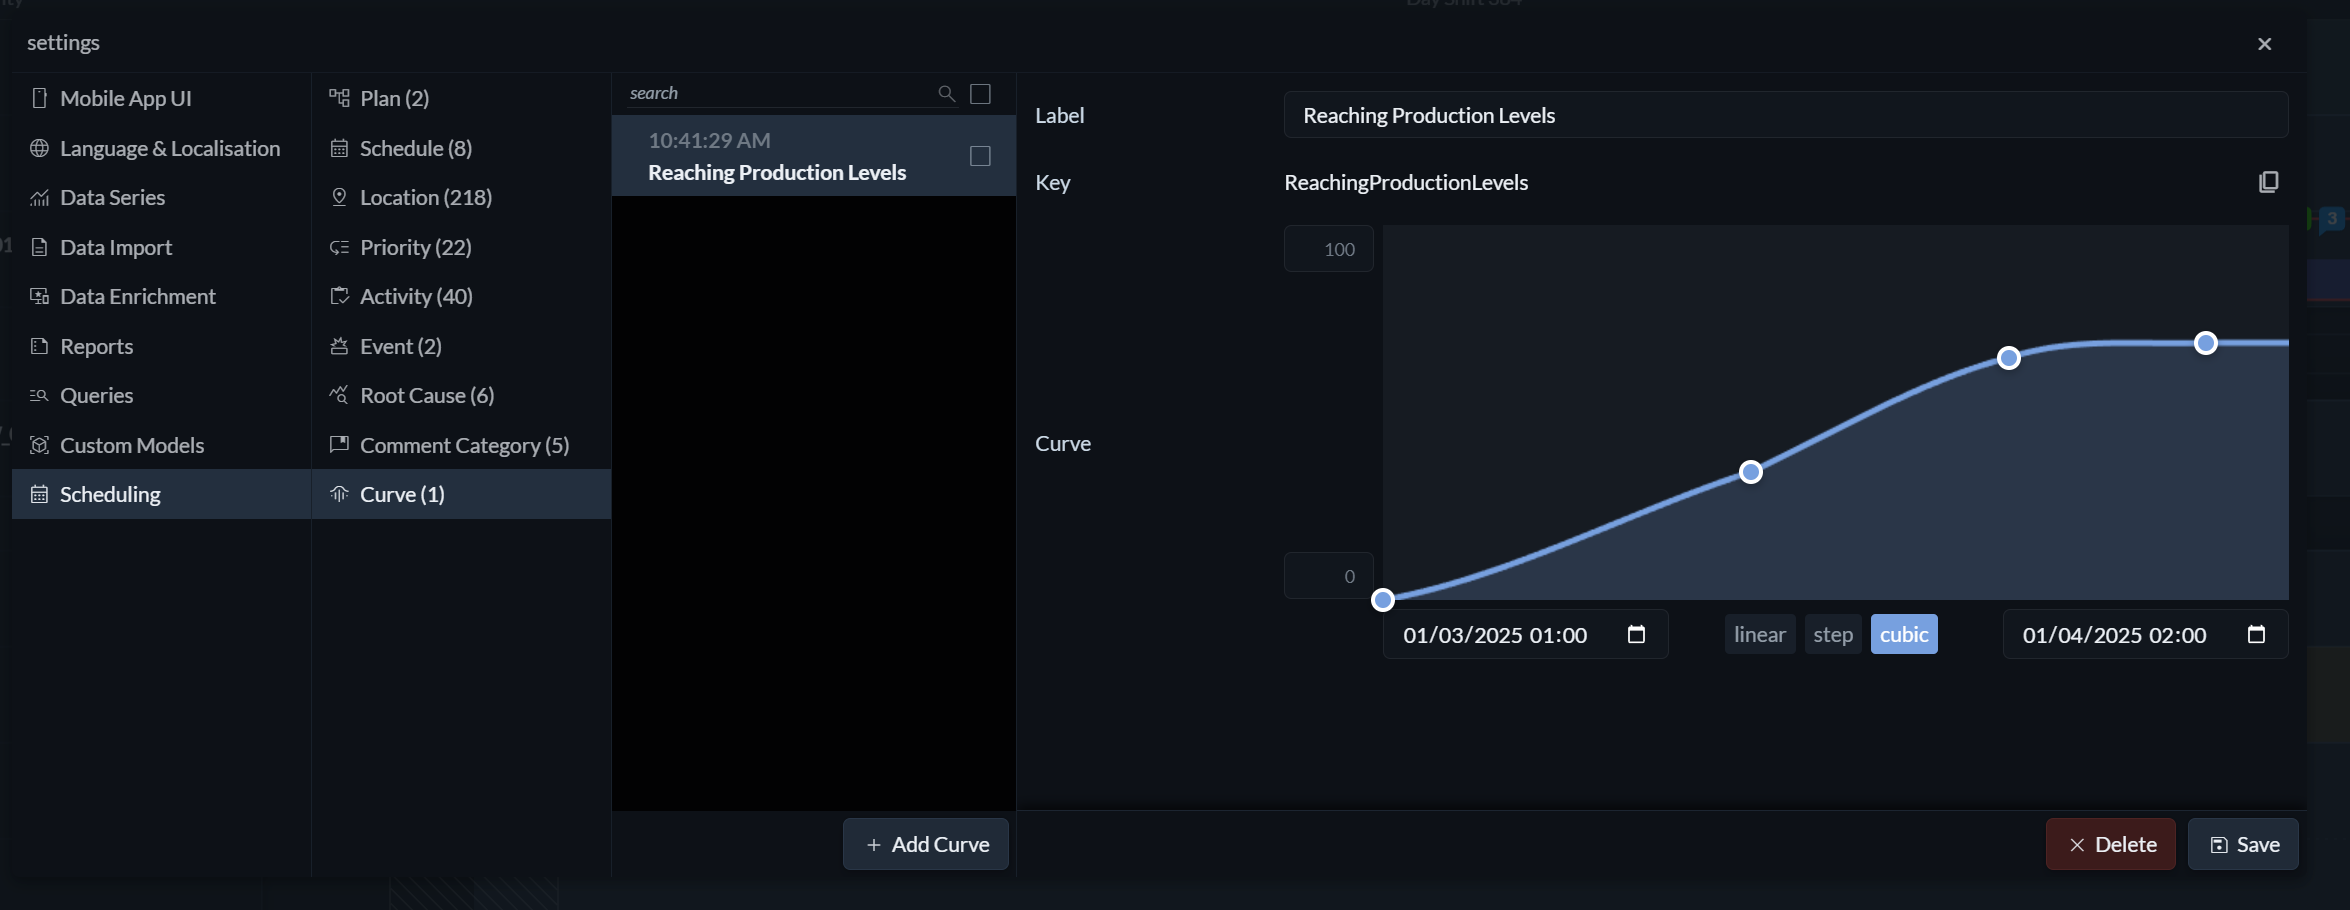 To create and configure a curve, open the Settings menu (the three horizontal lines on the right) and navigate to Scheduling → Curve. Here, you define a label, the timeframe over which the change should occur, and the overall level of improvement or decline you want to achieve.
Hivekit supports linear, step, and cubic curves. Curve points can be added by clicking directly on the curve and removed by dragging them outside of it. Once you are satisfied with the shape and progression of the curve, click Save.
Applying curves
Curves return a value between 0 and 1 for any given date within their timeframe. This value can be used directly in metric formulas.
To apply a curve to an expected metric, choose a metric of type Value or Rate and reference the curve using the syntax curve["curve label"]. For example, if your long-term target is to move 1,200 tons per day and you want to reach this gradually using a curve called “annual improvement”, you would define the expected rate as:
1200 * curve["annual improvement"]
This allows targets to increase smoothly over time while remaining fully visible and predictable to everyone involved.