How to render 10k+ markers on Google Maps
Google Maps is the most popular mapping solution out there. But when it comes to rendering thousands of map markers simultaneously using its built in API, its performance quickly breaks down. In this tutorial I'd like to show you how to render 10k+ markers on Google Maps using Hivekit data and a custom renderer.
But why would you even want to render that many objects on a map simultaneously?
For most use cases, you don’t. E.g. on real estate sites or maps that help you find the nearest coffee shop, it is often better to use Marker Clustering which conflates many markers into a single one with a number on it.
But then there are the other cases: Showing aircrafts in the sky, ships crossing the ocean or taxi drivers in New York is best done with individual markers. This way, users can see every object move individually when they zoom in and large scale patterns, such as air corridors, traffic jams or shipping lanes when they zoom out.
So - how many objects are we talking about?
The International Air Transport Association (IATA) tracks between 8,000 and 13,000 aircraft in the sky at any given time. There are 13,237 taxis in New York (yes, exactly that number) and the world's oceans are navigated by an average of 90,000 ships with a transponder.
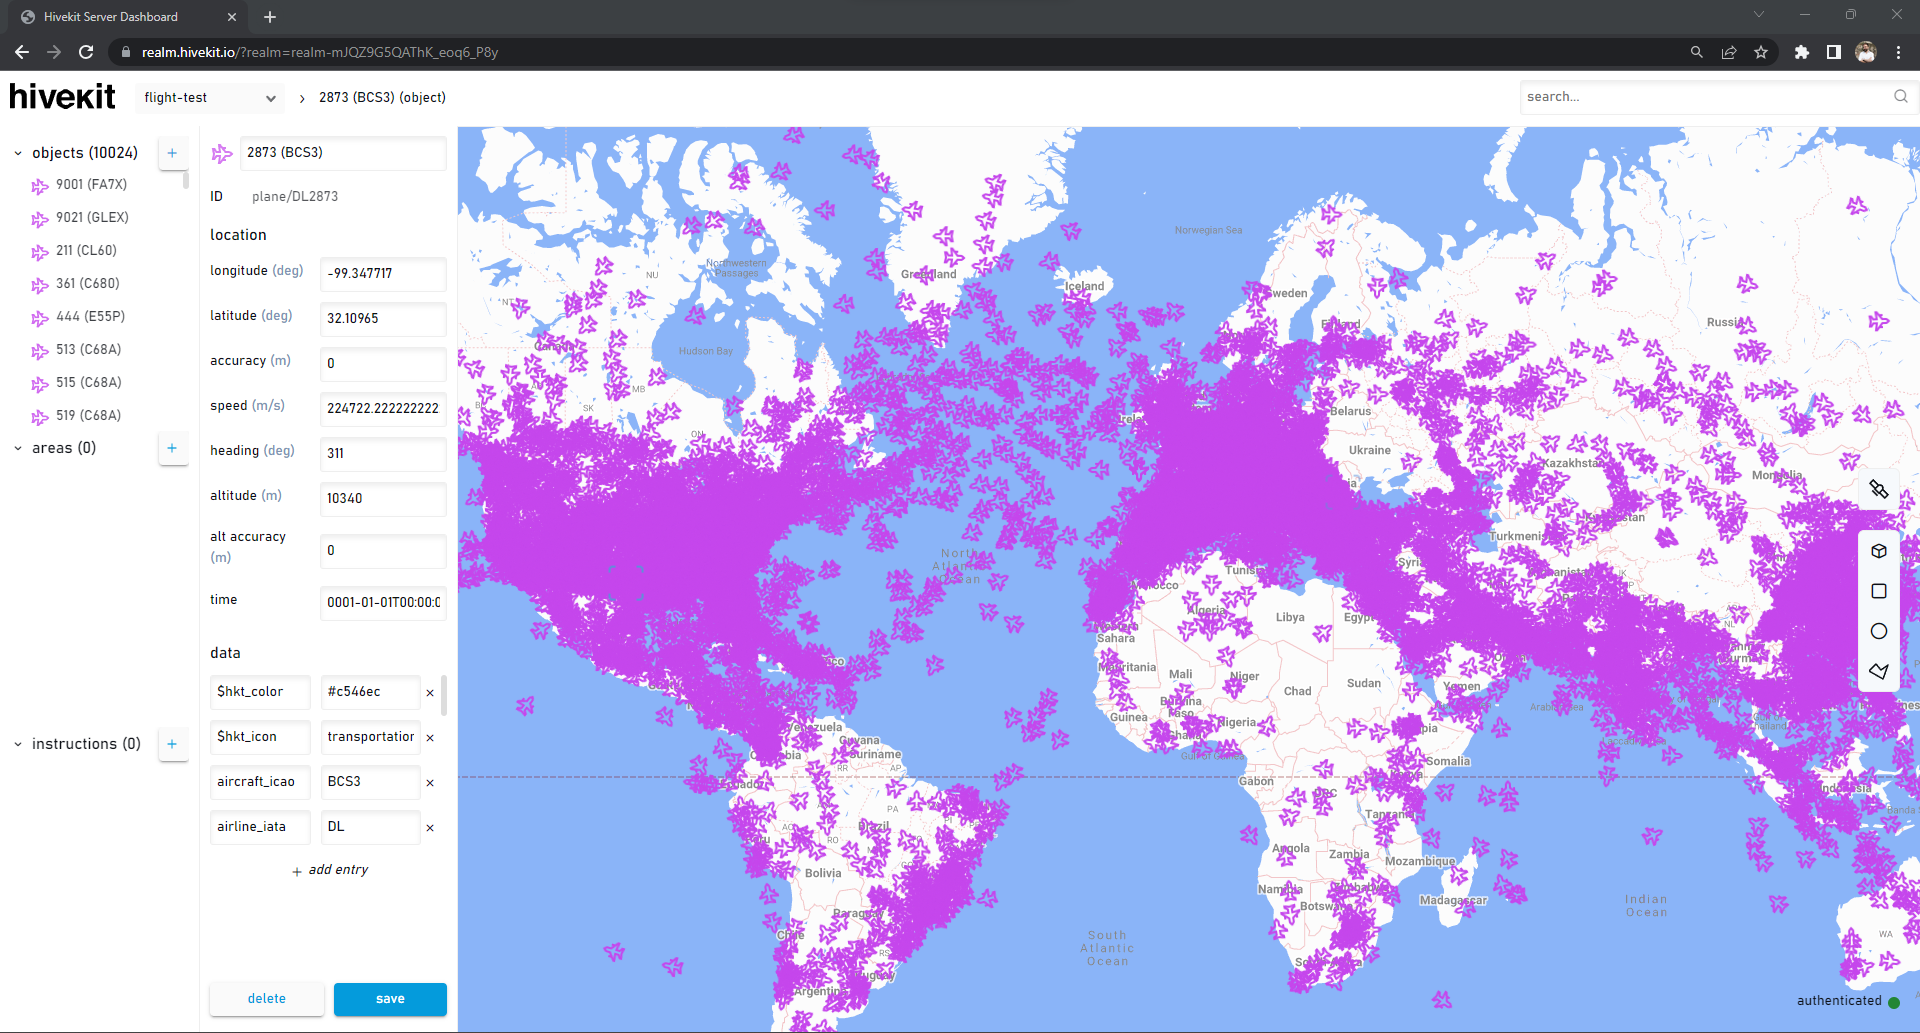
Displaying these with Google Map’s inbuilt markers will quickly lead to performance bottlenecks that make your application unusable. Our own dashboard on the other hand can easily handle 100k+ objects. In this tutorial I want to show you how we do this and provide the code to replicate it in your own app.
How do you send location updates for ten-thousand objects to your end-users?
Ok - this is a bit of a biased question - you’re reading this on the hivekit.io site - and ingesting, processing, storing and distributing large quantities of realtime location data is exactly what we do. So - try us out for free to see if we’re a good fit for your use case.
Let’s get started:
You can find the code for this tutorial on Hivekit's Github
We’ll do a few things to get the most performance out of our map:
- We use a custom, canvas based pixel renderer, wrapped in a
google.maps.OverlayView - We only render objects that are visible
- We use a spritesheet (a png containing a number of individual icons in a single image) to speed up loading and rely on -
globalCompositeOperationfor color and canvas transforms for rotation - We don’t rely on the DOM for mouseevents, but write our own click detection
This tutorial builds on top of our general Google maps integration tutorial, so we won’t cover integration here.
1. Create a custom overlay view
Google Maps has a concept of a google.maps.OverlayView that allows you to render custom content on top of a map (see docs). But there's a problem: Google intended this API for DOM elements, e.g. divs or images that live on top of the map, move and zoom with it. What we want to do is to add a static canvas that covers the entire map and draw on that. So, we'll be cheating a little. We start by creating a marker renderer class that extends google.maps.OverlayView and adds a canvas to a parent element of Google Map's overlay pane.
export default class MarkerRenderer extends google.maps.OverlayView {
    constructor(googleMap) {
        super();
        this.setMap(googleMap);
    }

    onAdd() {
        this.canvas = document.createElement('canvas');
        this.canvas.style.position = 'absolute';
        this.canvas.style.top = 0;
        this.canvas.style.left = 0;
        this.canvas.style.width = this.map.getDiv().offsetWidth + 'px';
        this.canvas.style.height = this.map.getDiv().offsetHeight + 'px';
        this.canvas.style.pointerEvents = 'none';
        this.canvas.style.zIndex = 2;

        // you're supposed to append the canvas to the overlayLayer, but that doesn't work for us
        // so we'll go up the DOM tree a bit until we find the first parent that doesn't
        // move when panning or zooming
        this.getPanes().floatPane.parentNode.parentNode.appendChild(this.canvas);
        this.ctx = this.canvas.getContext('2d');
    }

    //this will be called when the Hivekit received new location data
    setObjects(objects) {
        this.objects = objects;
        this.draw();
    }

    draw() {
        // google maps will invoke this method whenever the map is panned, zoomed
        // or otherwise needs redrawing.
    }

    onRemove() {
        this.canvas.parentNode.removeChild(this.canvas);
        this.canvas = null;
    }
}
2. Subscribe to location updates from Hivekit
In the previous Google maps integration tutorial we've used a Hivekit subscription that was scoped to the visible area of the map. This is great for most use cases, but in this example we want to optimize for a smooth zooming and panning experience - at the expense of having to handle more incoming data. So we'll initialize our connection with:
import HivekitClient from '@hivekit/client-js'

const authToken = 'eyJhbGciOiJIUzI1NiIsInR5cCI6IkpXVCIsImtpZCI6Ims1anN3VzB6c0kydTFvVldNRV9VbCJ9.eyJzdWIiOiJzZXJ2aWNlIiwidG5kIjoiQmJzRHpaeDBvSHpERzVjVm9GNUdBIiwiZXhwIjo0ODQyODM1NDM0LCJwZXIiOnsicmVhbG0tbUpRWjlHNVFBVGhLX2VvcTZfUDh5Ijp7IioiOiJDUlVEUCJ9fSwiaWF0IjoxNjg5MjM1NDcxLCJpc3MiOiJwbGF0Zm9ybS5oaXZla2l0LmlvIiwianRpIjoiekdaNFg5Zk1RbmtRSDh4SmU4dUFWIn0.InspvvRqHqBQ6r_OTNJnNCBVSU3NgQjueQFzOaV1kTU';

const hivekitClient = new HivekitClient();
await hivekitClient.connect('wss://api.hivekit.io/v1/ws');
await hivekitClient.authenticate(authToken);
const realm = await hivekitClient.realm.get('realm-mJQZ9G5QAThK_eoq6_P8y');

// We'll subscribe to the entire world straight away. This means we'll get more
// data, but our markers will render more fluently
const subscription = await realm.object.subscribe({
    executeImmediately: true
});
subscription.on('update', objects => {
    markerRenderer.setObjects(objects);
});
3. Find out which markers need rendering and where to put them
Whenever draw() is called, we'll iterate through all objects, find the pixel coordinates on the screen that relate to their latitude and longitude and check if they're visible.
    draw() {
        // the projection class gives us access to the google maps projection.
        // this is needed to convert lat/lng coordinates to pixel coordinates
        const projection = this.getProjection();
        const width = this.canvas.offsetWidth;
        const height = this.canvas.offsetHeight;

        if (!projection) {
            return;
        }

        // clear the canvas
        this.ctx.clearRect(0, 0, width, height);

        for (let id in this.objects) {

            // iterate through all the objects and figure out
            // whether they are visible on the canvas.
            let obj = this.objects[id];

            let point = projection.fromLatLngToContainerPixel({
                lat: obj.location.latitude,
                lng: obj.location.longitude
            });

            // if the projection can not resolve the coordinates, the object is not visible
            if (!point) {
                continue;
            }

            // if the object is outside the visible screen, we don't need to draw it
            if (point.x < 0 || point.y < 0 || point.x > width || point.y > height) {
                continue;
            }

            // here, we have point.x and point.y for an object that needs drawing
        }
    }
4. Rendering the object
Now that we know which objects need rendering and where to put them, its finally time to put something on the screen.
This something should be an icon with a particular color and a particular rotation, representing the object's heading
in Hivekit.
We'll store the icon to use and the color in the object's data in Hivekit. This way we can combine different icons and colors in the same map.
// we read the icon and color from the Hivekit object data. This
// way we can combine different icons and colors here
let icon = obj.data.icon || 'fighter-jet';
let color = obj.data.color || '#FF00FF';
let iconSize = 24;

 // we'll talk about this in the next section
let image = iconCache.get(icon, color);

// in order to rotate the icon, we need to get its angle in radians
let angleInRadians = ((obj.location.heading || 0) - 90) * Math.PI / 180;

// we translate and rotate the canvas context to draw the rotated icon
this.ctx.translate(point.x, point.y);
this.ctx.rotate(angleInRadians);
this.ctx.drawImage(image, -iconSize / 2, -iconSize / 2, iconSize, iconSize);
this.ctx.rotate(-angleInRadians);
this.ctx.translate(-point.x, -point.y);
5. Efficiently loading icons
Loading many different icons in many different colors is slow and can be cumbersome. For our renderer, we instead load a single png that has all the icons on them. It looks like this:
![]()
Every individual icon is exactly 24x24 pixels and has a transparent background. In order to figure out which position in the spreadsheet we need, we maintain a list of icon names that matches the order in the spritesheet, e.g.
export default [
    'apache-helicopter',
    'atv',
    'auto-rickshaw',
    'battleship',
    'bicycle',
    'bulldozer',
    //...
But there is one more problem: all the icons are black. In order to color them, we use the globalCompositeOperation property of the canvas context. This property determines how the canvas context will draw new shapes on top of existing shapes.
Armed with the loaded spritesheet, a knowledge of the icons position and a way to color it, we can now write an IconCache - a class that will provide a tiny canvas with the colored icon for us to draw on the bigger canvas atop the map. Here's what that looks like:
import iconList from "./icon-list.js";

export default class IconCache {
    constructor(map) {
        this.map = map;
        this.spriteSheet = null;
        this.icons = {};
    }

    async init() {
        this.spriteSheet = await this.loadImage('transportation-icons.png');
    }

    // if we can, we just return a stored icon. If not, we create it
    get(id, color) {
        const key = `${id}-${color}`;
        if (!this.icons[key]) {
            this.icons[key] = this.create(id, color);
        }
        return this.icons[key];
    }

    create(id, color) {
        const canvas = document.createElement('canvas');
        const iconSize = 24;
        canvas.width = iconSize;
        canvas.height = iconSize;
        const ctx = canvas.getContext('2d');

        // our icon is black with a transparent background. In
        // order to create a colored version, we first fill the
        // entire canvas with the desired color
        ctx.fillStyle = color;
        ctx.fillRect(0, 0, iconSize, iconSize);

        // then we set the way to pixels are blended on top of each other
        // to "destination-in". This means that the next thing we draw
        // will only affect the transparency of the existing solid color
        ctx.globalCompositeOperation = "destination-in";

        // Now we pick the icon from the spritesheet and draw it onto the canvas.
        const spriteSheetX = iconList.indexOf(id) * iconSize;
        ctx.drawImage(this.spriteSheet, spriteSheetX, 0, iconSize, iconSize, 0, 0, iconSize, iconSize);
        return canvas;
    }

    async loadImage(url) {
        return new Promise(resolve => {
            const img = new Image();
            img.addEventListener('load', () => {
                resolve(img);
            }, false);
            img.src = url;
        });
    }
}
6. Putting it all together
We now have all the pieces we need to render our objects on the map. We just need to put them together. There's also some additional things we may want, e.g. the ability to hover over or select objects. You can find the full code powering the example at the start of the arcticle here:
Browse the full tutorial's code on Github
If you'd like to give Hivekit a try, sign up for a free account and if you have any questions about this tutorial, ping us on Discord.