Hexagons and Hilbert Curves - The Headaches of Distributed Spatial Indices

There are some problems in computer science that look simple at first, but turn out to be near impossible to solve at scale: Finding the shortest route for a road trip across a few cities is such a problem. Want to visit just 16 cities on your trip? - That’s 1.3 Trillion possible routes you need to consider.
Here’s another one: Say you have a map with 10k moving vehicles. And you want to know for each vehicle if another vehicle is closer than a given distance. For a naive implementation this means that you need to check each vehicle against all other vehicles - every time any position is updated. If each sends one update a second, that’s a hefty 360 Trillion checks per hour. That’s a problem. But this time, it’s different. Because this one - is our problem.
How we’ve got ourselves into this mess.
We’re building a clusterable server that lets you track people and vehicles and stream their location to end user devices. It’s packed with all sorts of persistence, querying and filtering features - so far, so easy - but there’s a hard part: Our server doesn’t just broadcast data, it also lets you run logic on it. Logic is expressed as short scripts in a simple language called HiveScript.
Here’s for instance an instruction that triggers when an electric scooter’s charge falls below 20% and adds a task to the todo list of the nearest maintenance van:
when
   object(type="scooter", battery<20)
then
   createTask("charge", "charge scooter", nearest(type="maintenance-van"))
…you get the idea. But as our tech grows in adoption, our customer’s use cases are becoming more ambitious. And now we have a customer that wants to build a near pass detection alert for their large vehicle fleet using such a rule.
So - here’s how we go about solving it:
Let’s start with the basics. Running 360 Trillion checks an hour is of course unfeasible. But really, you wouldn’t need to. Instead, you’d check each vehicle only against vehicles that you already know are near. To do this, you’d organize the space you operate in into grid cells.
…already much better. We just keep a registry of each vehicle in a grid cell and now we only need to check a vehicle’s cell plus the 8 adjacent cells.

But square cells aren’t ideal for that. They have irregular distances from each other - the corner cells are farther from the center than the side cells. So - how about a shape that tessellates, but doesn’t have that problem?
Getting Hexagonal

Hexagons are the Bestagons!. (No, seriously, watch this video, it’s great.). Amongst many of their amazing properties is the fact that each adjacent cell is equal distance from the center cell.
Uber recognized this and built their entire, world wide location grid around hexagons.
But an even grid of hexagons is still not ideal. If you cover the world with Hexagons, you’ll end up with a largely empty hexagon above the Sahara desert and an incredibly packed hexagon above the center of Tokyo.
What we really need is a structure that adjusts to density, but still makes location based lookups easy and fast.
Introducing R-Trees

Invented in 1984, R(ectangle)-Trees are precisely as old as me, but have held up much better. They cluster objects in two dimensional space into irregular rectangles, nested within other rectangles. This makes it possible to lookup nearby vehicles in O(logMn) time which is almost linear-ish. Inserting can take a bit longer, but is still reasonably fast.
Given this, we’ve chosen R-Trees as the foundational spatial index for our server - and things scale really nicely… up to a point.
How our server works
In order to understand the next bit, you need to understand how our server is architected. It comes as a single binary that can happily run on its own. But - if you need more scale, you can cluster it by running two layers of the binary with different roles:
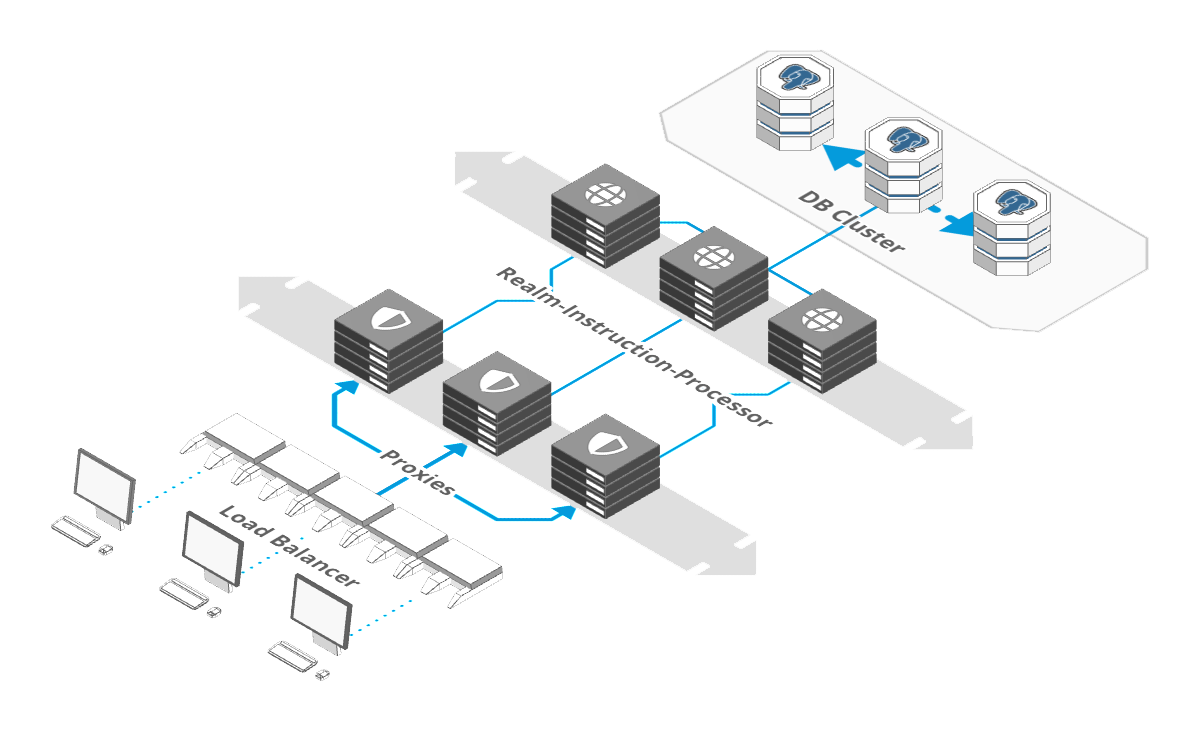
Proxies sit in front and face the internet. They handle inbound connections from vehicles and devices, authenticate them, parse and validate their messages and check permissions.
Then, the message is forwarded to a second set of instances with a role of “Realm-Instruction-Processor” or RIP for short.
A “Realm”, in Hivekit parlance is a space within which something happens - it encapsulates all other concepts, a bit like how a database in Postgres contains tables, functions, indices and so on. Realms and positions are stored and processed in memory which makes our server extremely fast - but it also means that each realm has to be hosted on a single Realm-Instruction-Processor.
The proxies know which RIP takes care of which Realm and route messages accordingly - but splitting a Realm across multiple nodes is where the rubber really hits the road.
The headaches of distributing a spatial index
So - how do you distribute a nested, dynamic spatial index like an R-Tree across multiple nodes? This is the super hard question that we’re currently working on. We have a rather promising solution in the making and it will soon be ready for showtime - so I felt it’s a good time to talk about it. Here’s how we’ve approached it:
Hey Hilbert!

We’ve started by squeezing a one-dimensional curve into a two dimensional space. There are various versions of these space filling curves - but the one we went with is called a Hilbert Curve after its inventor David Hilbert.
The idea is simple: You have a self-repeating, fractal curve that you overlay over a two dimensional space. Every vehicle within that space has thus a position on that curve. The great thing about that is, that positions on a single line are expressed as a single number. So, a vehicle with a Hilbert Curve position of 0.34 is really close to one with 0.35 and really far from one with 0.89. That makes it super easy to find things that are nearby and would make for a good solution to the spatial lookup problem by itself - if it wasn’t for the density aspect (remember, the Sahara vs Tokyo thing.)
But what if…
But what if we could take a Hilbert Curve, and squeeze it into an R-Tree? Wouldn’t that give us the best of both worlds? It turns out, it would! Unfortunately, I can’t take credit for this idea either. It’s called a Hilbert R-Tree and is used to map higher dimensions to R-Trees. But what if the higher dimension isn’t spatial - but instead the index of a server node in a cluster? Ahhhhh…..now that’s some juicy insight.
We’re currently implementing a sharded, spatial index based on this principle -and things seem to be working well. If this works out like we imagine and lookup and insertion times stay close to linear, this might - hopefully - be an extremely elegant solution to a relevant problem that’s fairly underserved at the moment.
A bit of advertising:
Even without it though - if you’re building a geospatial application, be it for urban mobility, logistics, tracking etc - the Hivekit server is a fairly impressive bit of kit that makes for a solid, scalable and feature rich backbone to build upon. You can use it as a hosted API or on your own Premises.